Graphviz es una colección de software para representar grafos, muy flexible, pero requiere un cierto esfuerzo de aprendizaje. El paquete del CPAN GraphViz nos ofrece una interfaz sencilla al software original, perdiendo algunas capacidades.
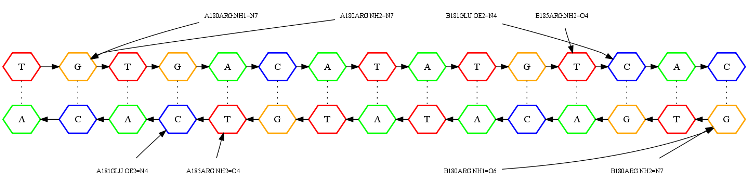
Aquí os muestro el código utilizado para generar este diagrama esquemático de la interfaz entre un factor de transcripción y una molécula de DNA:
# graphviz example by Bruno Contreras Moreira
use warnings;
use strict;
use lib "IPC-Run-0.80/lib/";
use lib "GraphViz-2.03/lib/";
use GraphViz;

my %nt_colors = ('A'=>'green','G'=>'orange','C'=>'blue','T'=>'red');

my @interface_contacts = ( # define a set of protein-DNA atomic contacts
'ARG  NH1  A0180 <- 2.89 ->  DG   N7 a0010',
'ARG  NH2  A0180 <- 2.74 ->  DG   N7 a0010',
'GLU  OE2  A0181 <- 3.30 ->  DC   N4 b0021',
'ARG  NH2  A0185 <- 2.76 ->  DT   O4 b0020',
'ARG  NH1  B0180 <- 3.27 ->  DG   O6 b0010',
'ARG  NH2  B0180 <- 2.74 ->  DG   N7 b0010',
'GLU  OE2  B0181 <- 2.91 ->  DC   N4 a0021',
'ARG  NH2  B0185 <- 2.62 ->  DT   O4 a0020'  );

my @DNA_duplex_pairs = ( # define a DNA duplex
'DT a0009 == DA b0024','DG a0010 == DC b0023',
'DT a0011 == DA b0022','DG a0012 == DC b0021',
'DA a0013 == DT b0020','DC a0014 == DG b0019',
'DA a0015 == DT b0018','DT a0016 == DA b0017',
'DA a0017 == DT b0016','DT a0018 == DA b0015',
'DG a0019 == DC b0014','DT a0020 == DA b0013',
'DC a0021 == DG b0012','DA a0022 == DT b0011',
'DC a0023 == DG b0010' );

my $diagram_file = draw_interface_graph('test_diagram',\@interface_contacts,@DNA_duplex_pairs);

print "# $diagram_file\n";

### codigo de la subrutina ###

sub draw_interface_graph
{
	my ($name,$ref_atomic_contacts,@duplex_pairs) = @_;

	my $graph_filename = $name."_interface_graph.png";

	my ($n_of_nts,$pair,$b,$contact,$nt,$aatom,$aalabel,$rank) = (0);
	my (@strand1,@strand2,@nodes1,@nodes2,%previous_contact,$base);

	my $interface = GraphViz->new(name=>'interface',overlap=>'compress');

	## -1) separate strands
	foreach $pair (@duplex_pairs)
	{
		if($pair =~ m/D(\w{1}) (\S+) == D(\w{1}) (\S+)/)
		{
			push(@strand1,$1.' '.$2);
			push(@strand2,$3.' '.$4);
			$n_of_nts++;
		}
	}

	## 0) define top and bottom layers, 1 & 4 (2 & 3 are dna strands)
	$interface->add_node('1',rank=>'1',style=>'invis');
	$interface->add_node('4',rank=>'4',style=>'invis');

	## 1) define nucleotides in layers 2 and 3, filling indirectly readout residues and adding missing bases
	for($nt=0;$nt<$n_of_nts;$nt++)# 1.1) strand1
	{
		($b,$base) = split(/ /,$strand1[$nt]);
		$nodes1[$nt] = $base;
		$interface->add_node($base,shape=>'hexagon',rank => '2',label=>$b,color=>$nt_colors{$b},style=>'bold');
	}

	for($nt=0;$nt<$n_of_nts;$nt++)# 1.2) strand2
	{
		($b,$base) = split(/ /,$strand2[$nt]);
		$nodes2[$nt] = $base;
		$interface->add_node($base,shape=>'hexagon',rank => '3',label=>$b,color=>$nt_colors{$b},style=>'bold');
	}

	## 2) invisibly wire the layers
	for($nt=0;$nt<$n_of_nts;$nt++)# 2.1) layer 1->2
	{
		$interface->add_edge('1' => $nodes1[$nt],weight=>0,style=>'invis'); # weight necesario para que respete layers
	}
	for($nt=0;$nt<$n_of_nts;$nt++){ $interface->add_edge($nodes2[$nt] => '4',weight=>0,style=>'invis'); }# 2.2) layer 3->4

	## 3) add phosphodiester bonds
	for($nt=1;$nt<$n_of_nts;$nt++)# 3.1) strand1
	{
		$interface->add_edge($nodes1[$nt-1] => $nodes1[$nt],constraint=>'false');
		# constraint necesario para que respete 5'->3'
	}

	my $reverse_n_of_nts = $n_of_nts; # 3.2) strand2
	for($nt=$n_of_nts-1;$nt>=1;$nt--)
	{
		$interface->add_edge($nodes2[$nt] => $nodes2[$nt-1],constraint=>'false');
		$reverse_n_of_nts--;
	}

	## 4) add double helix Hbonds
	for($nt=0;$nt<$n_of_nts;$nt++){ $interface->add_edge($nodes1[$nt]=>$nodes2[$nt],style=>'dotted',dir=>'none'); }

	## 5) define protein interface atoms and draw contacts: LYS   NZ  A0192 <- 3.05 ->  DG   O6 C0016
	foreach $contact (@{$ref_atomic_contacts})
	{
		my @data = split(/\s+/,$contact);
		$aatom = $data[2].$data[0].".".$data[1];
		$aatom =~ s/([A-Z])0+(.+)/$1$2/;
		$aalabel = $aatom ."=".$data[7];
		$base = $data[8];

		if(grep(/$base/,@nodes1)){ $rank = 1 }
		elsif(grep(/$base/,@nodes2)){ $rank = 4 }
		else{ die "# draw_interface_graph : cannot match base $base\n"; }

		$interface->add_node($aatom.$aalabel.$contact,rank=>$rank,shape=>'plaintext',weight=>0,label=>$aalabel,fontsize=>10);
		$interface->add_edge($aatom.$aalabel.$contact=>$base,style=>'solid',constraint=>'false');

		if($previous_contact{$rank}){ $interface->add_edge($previous_contact{$rank}=>$aatom.$aalabel.$contact,weight=>0,style=>'invis',constraint=>'false');}
		$previous_contact{$rank} = $aatom.$aalabel.$contact;
	}

	## 6) plot graph in both PNG and vectorial PS
	$interface->as_png($graph_filename);

	return ($graph_filename);
}